Report analysis
Every YourCX report is unique—tailored to the needs of you, your team, and your company. The way data is presented and the overall layout of the report are individually agreed upon with each partner, and the research projects we base our work on are designed to help achieve your set goals. If you have any suggestions or concerns, please feel free to consult with us.
We also understand that not everyone is a data analyst, and not everyone may feel comfortable analyzing consumer behaviors and experiences. Therefore, below we present descriptions of example histograms that you will often find in the reports you receive.
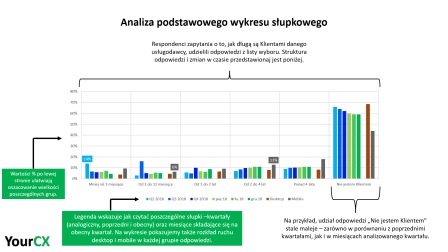
Example of a basic bar chart:

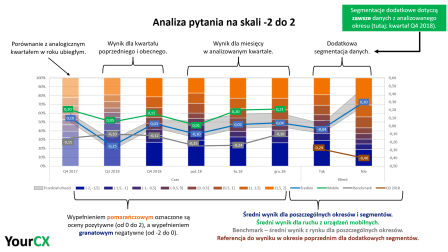
Slider-type question:

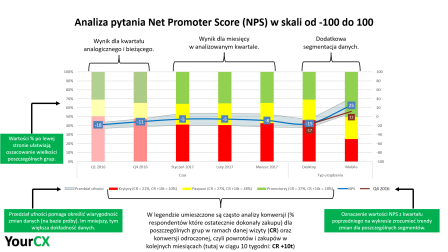
NPS – Recommendation Willingness Analysis:
