Configurable Survey Results
The survey results view presents aggregated respondent answers in the form of accessible visualizations and a detailed statistics table. On the left side of the screen, there is a list of questions that allows quick switching between individual topics to review their results. Each question is displayed in the central part of the screen using an interactive chart, which can be customized.
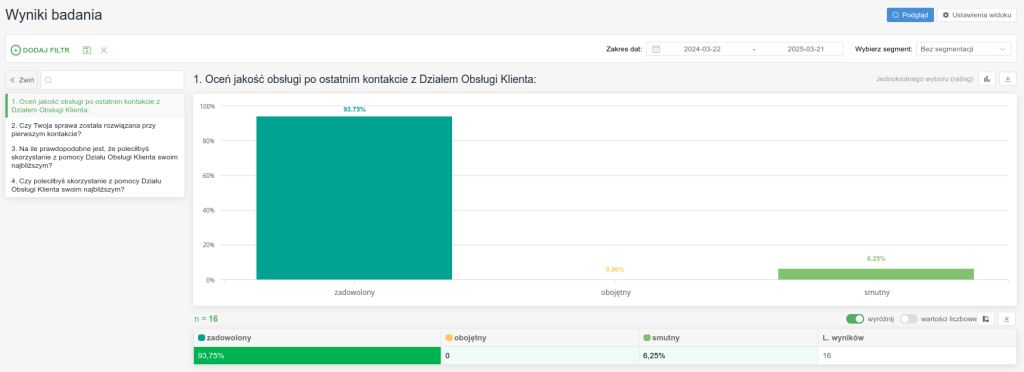
Above the chart, there is a bar with filters, personalization tools, and a date range selector—each element is configurable. Users can specify a date range (e.g., from 2024-03-22 to 2025-03-21), which allows narrowing the displayed data to a specific period, as well as select a segment from a dropdown list. This makes it easy to analyze, for example, only users accessing the mobile version of the site or only those who completed the survey in selected months. The “Preview” button enables a quick survey preview, while “View Settings” allow customization of how charts and tables are presented (for example, the default visualization type).
Just below the chart, a brief data summary is visible: the total number of responses (n=454) and a table breaking down individual answer options (e.g., “I like it very much,” “I like it,” “Hard to say,” “I don’t like it,” “I dislike it very much”). The table shows percentage values both for segments and overall results. Color highlights (green or orange) help quickly identify where the share of a particular response is highest or lowest. Aggregate results are also collected in the lower part of the table, enabling a quick assessment of which response options dominate the entire sample.
The entire view supports interaction and flexible analysis: at any time, you can “add a filter” (button visible above the question list) to apply additional criteria limiting the displayed data (e.g., only participants who consented to email contact or respondents rating the service highly in other questions). This makes the “Survey Results” section a place where analysts or researchers can examine response distributions, adjust the level of detail, and easily switch between different questions and time periods—all in one place.
Read more about the capabilities of the results view.