Configurable Basic View
Key information about the survey is gathered in one place to enable a quick overview of the most important metrics. At the top of the screen, there is a "Survey Summary" section, which displays the total number of survey completions, number of views, completion-to-view ratio, and the percentage of completed responses. Each of these parameters is accompanied by a small line chart, making it easier to observe changes over time and quickly identify any spikes or drops in engagement.
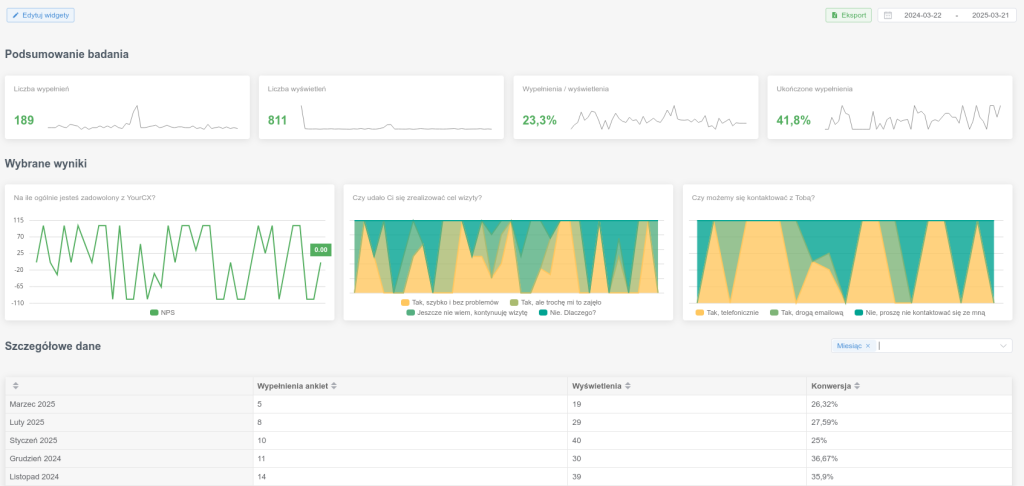
Below are the “Selected Results,” which provide an initial summary of the key questions. In the sample report, we can see, among other things, a line chart illustrating the NPS (Net Promoter Score) value and a chart showing the distribution of answers to the question of whether the user achieved their visit goal.
At the bottom of the view, there is a table with detailed data. It includes, among other things, dates (e.g., survey month), device type (Mobile or Desktop), number of survey completions and views during the period, and the conversion rate (i.e., the ratio of completions to views). The table allows drilling down to a lower level of detail to see a more precise distribution of results—for example, in which months and on which devices the survey was completed more frequently, and where users were less likely to finish the survey. The “Export” button at the top enables downloading this data in the selected format, while time and device filters (e.g., “Month,” “Mobile / Desktop”) allow narrowing the analysis scope to specific groups or periods.
This view configuration provides a quick overview of the survey status and current trends in results and survey effectiveness. At the same time, the system allows widget editing, enabling customization of the layout and type of displayed information to specific analytical or reporting needs. All of this makes this view a convenient starting point for further, more in-depth analysis of results in individual reports or dashboards.