User Flows
User flows visualize the paths customers take while interacting with your website or application. Analyzing these paths helps identify where users most often drop off, as well as which areas drive the highest engagement. All of this can be viewed in the context of any survey question, allowing you to correlate user behavior with customer feedback.
YourCX offers advanced user flow analysis features, including:
Grouped or individual path views: Analyze the behavior of entire user segments or drill down into individual journeys.
Time spent on pages: Discover which pages capture attention and where users spend the most time.
Segmentation by survey results: Filter and segment user flows based on customer attributes or declarative survey responses. Compare behaviors of satisfied versus dissatisfied users.
Reverse path analysis: Identify critical drop-off points by analyzing where users leave the site.
View by URL or page type: Analyze traffic at the level of specific URLs or page categories.
Highlighting key paths: Emphasize the most commonly followed routes and high-impact areas.
Minimum share threshold: Exclude less significant paths to focus on the most relevant data.
Mid-flow analysis: Select any point (node) to explore user steps before and after it.
Between-point analysis: Track user journeys between two defined stages in the user process.
Use Cases for User Flow Analysis
User flow analysis supports a wide range of business objectives, including:
Hypothesis validation: Test assumptions about user behavior with real interaction data.
Identifying problem areas: Pinpoint friction points in the user experience.
Creating purchase funnels: Analyze buying journeys to improve conversion rates.
Sales optimization: Understand where and why customers drop out of the purchase process, then apply targeted improvements.
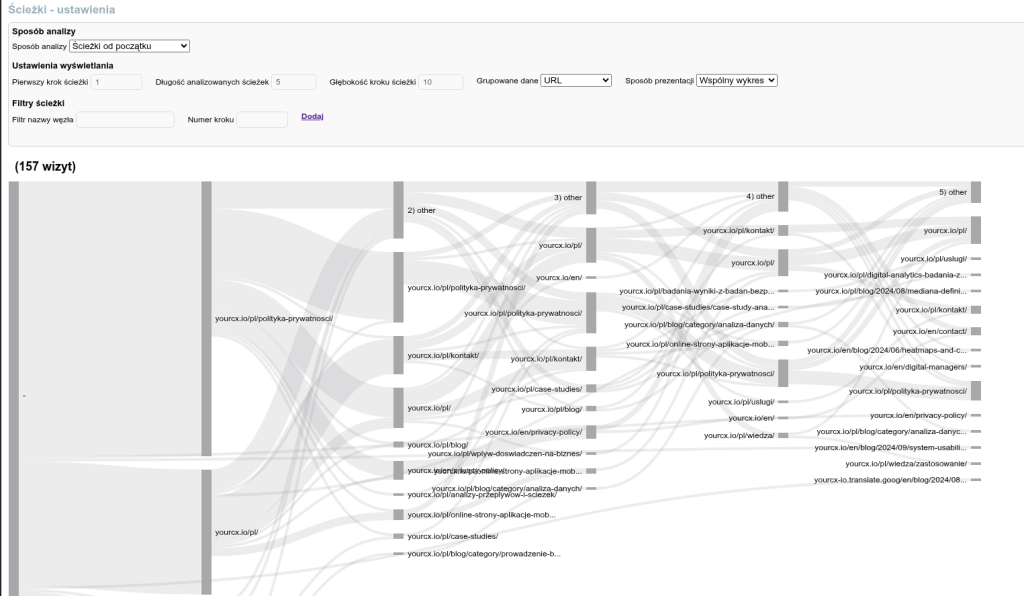
Configuring User Flow Analysis in YourCX
The User Flow module in YourCX enables you to precisely trace how users move through your site—from entry to exit. This helps you identify common behavior patterns, drop-off points, and ideal moments for displaying surveys.
Types of analysis available:
Start-point flows: Visualize paths beginning from the entry page (e.g., homepage, landing page).
End-point flows: Analyze what happens before users leave the site.
Between two nodes: Track paths between two defined points (e.g., from category page to order summary).
Through a node: Explore flows that include a specific node (e.g., terms & conditions, cart page).
Display settings:
First step of the path: Define which step to start the analysis from (default: step 1).
Maximum path length: Limit the number of steps shown per path (e.g., 5 steps maximum).
Step depth: Define how many subsequent clicks to track from each step (e.g., 10 next steps).
Data grouping options (Grouped data):
URL: Basic URLs, excluding parameters.
Full URL: Full address including parameters (e.g.,
?utm_source=...).Page type: Grouping by predefined categories (e.g., product, cart, checkout).
Subpage type: Use your own custom classification (if implemented).
Visualization options:
Combined chart: Display all flows in a single chart for quick comparison and high-level insights.
Separate charts: Display each flow individually—useful for analyzing specific segments in detail.
Path filters:
You can limit your analysis to flows containing specific nodes (e.g., a URL or page type), and define in which step that node must appear (e.g., show flows where /checkout appears in step 4).
Summary
User flow analysis in YourCX empowers businesses to better understand customer behavior and make more informed decisions. By leveraging detailed path insights, companies can identify bottlenecks, optimize user experiences, and ultimately boost performance.