Survey Results
The Survey Results section in YourCX is a powerful analytics module designed to enable in-depth analysis of customer feedback data. With a wide range of features, users can filter, segment, and interpret results in ways tailored to their specific needs. Below are the key capabilities of this section.
1. Filtering Results

The filtering function allows you to narrow down results to specific groups, making data analysis more focused and effective.
Filtering categories – Choose from a wide range of filters such as survey questions, customer segments, analytical data, respondent location, visit sources, technical data, and more.
Rule and value definition – Users can create specific filtering conditions for precise analysis.
2. Data Segmentation
Segmenting results helps uncover behavioral patterns and differences between customer groups.
Segmenting by dimensions – Results can be divided based on survey questions, customer segments, analytical data, respondent location, visit sources, technical data, and more.
Overall insights – The “No segmentation” option enables a holistic view of general trends.
3. Question Overview and Navigation
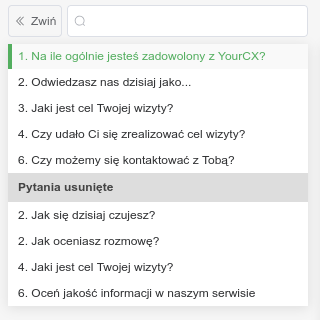
Individual question display – Each survey question is presented separately, allowing for in-depth analysis and contextual comparison of responses.
Switching between questions – Users can easily navigate from one question to another, streamlining result analysis.
Viewing deleted questions – Questions that were removed can still be reviewed, helping maintain historical context in data analysis.
Search functionality – In longer surveys, a search feature allows users to quickly locate specific questions of interest.
4. Chart View and Table Settings
Flexible display options help users tailor the presentation of data to their analytical needs.
Chart types – Choose between different data visualizations, such as bar charts, percentage charts, or multidimensional views.
Displayed question label – Select whether to show the internal question name, full question text, or associated tag.
Data layout options – Switch between row and column views to explore results from different perspectives.
5. Data Export
YourCX provides multiple export options to support further analysis and reporting:
Export to Excel – Download response data in a convenient spreadsheet format for deeper analysis.
Export charts as PNG files – Save visualizations as image files for presentations or reports.
6. Switching Between Percentage and Absolute Values
To enhance data interpretation, users can toggle how results are displayed:
Numeric values instead of percentages – Option to show raw counts rather than percentage values.
Highlighting top results – Key values are color-highlighted to improve readability and focus.
7. Advanced Analysis Options
For more detailed insights, advanced statistical tools are available:
Confidence intervals – Add confidence ranges and standard errors to results for more precise interpretation.
Extended data analytics – Access enhanced metrics and advanced calculations to support in-depth decision-making.
8. Survey Preview
Preview your survey before it goes live to ensure everything looks and functions as intended.
Live preview option – Click the “Preview” button to check the layout, question flow, and design of the survey in real-time.
9. Accessing Results During and After the Survey
YourCX provides continuous access to survey results, regardless of the survey’s status.
Real-time result tracking – View updated data as responses are collected.
Post-completion analysis – Continue exploring and analyzing results even after the survey has ended.
10. Time-Based Analysis
Filter results based on a selected time period to track trends and changes.
Flexible date range – Select any custom timeframe for detailed review.
Preset date filters – Use quick options such as the last 7, 30, 90, or 365 days, or current/previous month or quarter, or analyze results from the survey’s start date.
The “Survey Results” section in YourCX is a powerful analytics suite designed for businesses seeking to extract meaningful insights from customer feedback. With a wide range of analytical tools and flexible filtering options, users can uncover trends, understand customer needs, refine service strategies, and make data-driven business decisions with confidence.