Segmentation and Data Filtering
Segmentation and filtering are two core analytical tools that enable deeper insight into your survey data.
Filtering allows you to narrow down the dataset to focus on specific observations—such as responses from a particular channel, region, or customer type.
Segmentation divides your data into consistent, comparable groups, making it easy to spot differences and trends between them.
On the YourCX platform, any data point—whether collected through the survey or passed as metadata—can be used for both filtering and segmentation, giving you maximum flexibility in how you explore and interpret results.
Data Filtering
Filtering enables you to isolate only those responses from your dataset that meet specific criteria. For example, you might filter by:
Respondents in a specific age range (e.g., 25–34 years old)
Participants who reported living in a particular location (e.g., Warsaw)
Responses submitted from a specific channel (e.g., mobile devices)
Answers collected during a defined time period (e.g., June–July 2023)
Filters help you focus on the most relevant data for your analysis. For instance, if you want to evaluate how young customers perceive a new service, you can apply a filter for respondents aged 18–24 and analyze only that segment.
Example Use Case:
When analyzing satisfaction survey results (e.g., NPS), you might apply a filter to view scores only from customers who purchased online. This allows you to compare satisfaction levels between online and offline buyers.
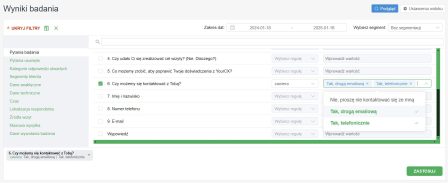
To apply filters, simply select the "Add Filter" option. Filters can be saved and configured with specific conditions tailored to each filter.
Available Segments
Just like filters, segments in the YourCX platform are organized into categories:
Survey Questions – Enable cross-tabulation based on other survey questions.
Open-Ended Answer Categories – Automatically or manually tagged categories from open-ended responses.
Customer Segments (optional) – Additional information passed directly to the platform via CRM, website code, survey URL, importer, or API. These segments depend on the survey setup and may include:
delivery method
delivery cost
cart value
product category
page type
customer type
search phrase
number of search results
checkout step
store ID
agent ID (for support-related surveys)
customer age
login status
total purchases
and any other custom parameters
To start passing additional segments, contact the YourCX team.
Analytical Data – Describes the respondent’s visit on the website (e.g. session depth, navigation paths).
Technical Data – Automatically collected data such as screen resolution, browser, operating system, device type (mobile/desktop), survey domain, referrer domain, etc. Useful for identifying technical issues more accurately.
Traffic Sources – Includes data for analyzing user journey origins, useful for traffic segmentation.
Time – Enables trend analysis by day, week, month, quarter, hour of the day, day of the week, or day of the month.
Respondent Location – Based on automatic geolocation. Note: this method may have limitations, so exercise caution when interpreting such data.
Mass Distribution – Data related to bulk distribution of surveys via email or SMS.
Survey Triggering Data – Includes all metadata related to survey distribution within the YourCX platform:
Survey product – the survey delivery method
Pictogram mode – how declarative surveys are triggered
Display mode – how the survey appears to the user
Trigger type – the scenario that initiates the invitation
Language – based on the selected survey language settings
Data Segmentation
Segmentation involves dividing your data into categories (segments) to compare results across different groups. Unlike filtering, which narrows the view to one selected group, segmentation displays the results of multiple groups side-by-side on the same screen or within a single report.
Examples of Segments:
Region (Voivodeship)
The platform automatically groups responses by region, allowing you to, for example, compare the average NPS score in Mazowieckie vs. Śląskie.Age Group
Easily identify whether user impressions differ significantly between age groups like 18–24 vs. 35–44.Purchase Channel (in-store vs. online)
See how satisfaction ratings vary depending on whether the purchase was made in a physical store or online.Loyalty Metrics (NPS Segmentation)
Create segments like “Detractors” (NPS 0–6), “Passives” (7–8), and “Promoters” (9–10) to compare satisfaction across loyalty groups.
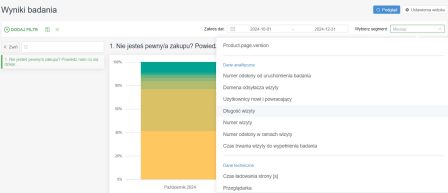
Segmentation in YourCX works by selecting any available field (e.g., a survey question or a custom variable) and using it as the comparison axis. The system then automatically groups responses by values and displays them side-by-side for comparison.
To segment your data, click the field under the Select segment label located in the upper right corner of the interface.
Benefits and Practical Applications
Easier Pattern Detection
Filters help you quickly isolate specific themes, such as low ratings in a particular region or feedback from a specific age group.
Segmentation lets you visualize and compare multiple groups within a single report, revealing patterns, differences, and similarities.
More Personalized Insights
If your business offers multiple product or service lines, segmentation helps uncover how satisfaction varies across them.
It also supports tailored conclusions about how to adjust messaging or offerings to better suit specific customer groups.
More Accurate Reporting
Reports can present an overall metric (like total NPS or overall satisfaction) while also drilling down into segment-level differences.
This makes reports clearer and more actionable, enabling managers to respond quickly to the needs of individual customer groups.