Conversion Funnels – Transition Analysis
Declarative data collected via surveys (e.g., visit intent, customer groups based on NPS responses, service ratings, reported issues) is combined with contextual data, including information about visited paths (pages the user navigated through).
Based on this combined dataset, you can analyze conversion rates not only for purchase-related goals but also for other declared user intents.
For example, you can assess:
What percentage of users who came to find contact information actually reached the contact page.
How far users with purchase intentions progressed within the buying process.
To use the conversion funnel analysis tool:
From the list of surveys, select the one you want to analyze.
In the menu on the left, click “Survey Results.”
Then navigate to the “Conversion Funnels” tool.
The conversion analysis interface will now be displayed.
Let’s go through each element of the funnel configuration step by step:
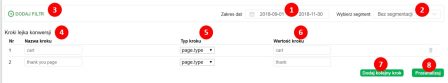
- Calendar – allows you to select the time range for your conversion analysis.
Tip: For surveys with smaller sample sizes, start with a broader time range—such as full quarters—for more stable results. - Segment – adds contextual depth to your analysis. This can be any survey question (e.g., visit purpose), a technical parameter (e.g., browser type), or any other data passed into the survey (e.g., customer groups from your CRM).
- Filter – a specific condition or set of conditions used to isolate data. Filters are best applied in special cases where standard segmentation doesn’t meet your analytical needs.
- Funnel steps – define the key touchpoints to analyze.
In the example provided, two steps are configured: cart and thank you page.
The first represents the shopping cart, and the second the order confirmation page.
This lets you measure, for example, what percentage of users reach the cart, and how many of them go on to complete a purchase (i.e., reach the thank you page). - Step label – the text you enter here serves as the label for each step in the funnel. Step type – defines how the step is identified. In the example, page.type is used—a parameter sent by YourCX tracking scripts to identify the type of page being viewed.
Alternatively, steps can be tracked using URL fragments or other page tags. - Step value – specifies how the system should recognize the step based on the selected type.
For example, if you're usingpage.type, this would be the name of the page type.
If you're tracking by URL, enter a URL fragment—e.g., if your thank you page contains the word "confirmation", enter that as the value. - Add next step – allows you to define an additional funnel step or touchpoint.
- Analyze – applies your settings and retrieves the relevant data from the database.
Once the data has been generated using these settings, you’ll receive the following insights:
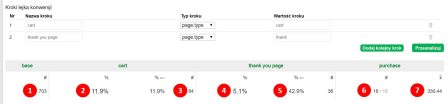
Number of users who completed the survey
What percentage of those users reached the first step in the conversion funnel (e.g., the cart)
How many users in total reached the cart
What percentage of users reached the second step in the funnel (e.g., the thank you page)
What percentage of users who reached the previous step (cart) proceeded to the analyzed step (thank you page)
The second number shown is the total number of users who completed a purchase,
while the first number represents those for whom we have additional information—e.g., the order value.Average order value for the selected segment
Let’s now analyze a conversion funnel using the same configuration, but segmented by visit intent:
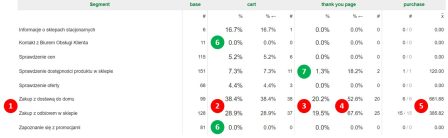
We can see that for the main purchase-related intents (home delivery vs. in-store pickup):
A slightly higher percentage of users who declared an intent to purchase with home delivery reached the cart (e.g., after adding products) — 38% compared to 29% for those preferring in-store pickup.
However, the percentage reaching the thank you page is nearly identical — 20% for home delivery and 19.5% for in-store pickup.
These differences become more evident when analyzing the conversion rate from cart to thank you page.
We also observe that the average order value for home delivery is significantly higher than for in-store pickup, although in this case, the sample size is quite small for order value analysis (n=6 for home delivery purchases).
Users whose declared intent was to contact customer service or check current promotions rarely reach the cart stage.
For the former group, this is expected—they are focused on finding contact information or support.
For the latter group, this suggests low actual interest in current promotions—users may browse for deals but end up finding nothing compelling enough to make a purchase.
Just over 1% of visitors whose goal was to check product availability in-store proceed to make a purchase.
This shows that users oriented toward traditional in-store shopping (simply checking if a product is available) rarely complete online transactions.