Cohorts – Analyzing the Impact of Experience Over Time
Cohort analysis based on declarative data allows you to examine how customer experiences influence long-term value (LTV), and to track user groups in the context of their past and future behavior—such as conversions, repeat visits, or churn.
This article will show you how to conduct such analyses independently using the YourCX panel. We’ll also walk you through practical examples of how YourCX’s advanced tools can be used to measure and understand customer experience over time.

To use the cohort and behavior analysis tool:
From the list of surveys, select the one you want to analyze.
In the left-hand menu, click “Survey Results.”
Then navigate to the “Cohorts” tool in the menu.
You’ll now see the cohort analysis interface.
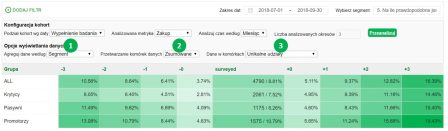
Let’s go through each part of the cohort configuration step by step:
![]()
- Calendar – allows you to select the time range for behavior analysis.
Note: Future behavior can only be analyzed based on historical data. So, if you're examining behavior over the three months following survey completion, make sure to select responses from at least three months ago. - Segment – provides additional context for analysis. This can be any survey question, technical parameter (e.g., browser type), or any other custom data passed into the survey (e.g., customer groups pulled from your CRM).
- Cohort grouping – by default, cohorts are grouped by the date the survey was completed. In specific cases, another reference point may be used, such as the date of an in-store visit or a live chat interaction.
- Analyzed metric – refers to the behavior you want to study. The default metrics are purchases (conversions) and visits.
- Time analysis window – defines the granularity of the timeline (e.g., by weeks, months, or quarters).
- Number of analyzed periods – lets you limit the view to a specific number of time intervals.
For example: If you select monthly intervals and set the number of periods to 3, the system will show user behavior 3 months before and 3 months after the survey was completed. - “Analyze” button – confirms the selected settings and loads the data.
Please note: For long time spans or large datasets, the initial data load may take a few minutes. Once processed, results are cached for faster future access.
You can aggregate data in the following ways:
By cohort date – displays behavior changes across selected time intervals.
By segment – groups the data by a selected segment.
In our example, the segment is a question about the likelihood of recommending the online store to a friend (used to calculate NPS), which allows you to analyze behaviors across Detractors, Passives, and Promoters (see: example analysis).Date → Segment – a variation of the above, showing segment distribution across selected periods.
Segment → Date – shows individual segments and the behavior trends over time within each one.
2. You can process cell data in two ways:
Separate – each column displays an individual value (e.g., conversion or visit rate for that period only).
Cumulative – each column accumulates values (e.g., cumulative conversion rate or visit count), giving you a full picture of how behaviors change over time.
3. Cell values represent the metric being analyzed:
Unique share – shows the percentage of users who performed a specific behavior (e.g., what % of users in a given group made a purchase before or after the survey).
Average of metric – an alternative value collected in the survey, such as average order value. This setting also shows the sample size for each period.
Average of metric (no sample size) – same as above, but without displaying the number of respondents per group.
Based on the configuration options above, you can now perform a sample analysis using the extracted data:
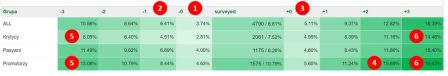
We can observe:
What percentage of users made a purchase in the same month before completing the survey.
What percentage made a purchase in the previous month before the survey.
What percentage of users made a purchase in the same month after completing the survey.
Since we are working with cumulative data, we can see that 15.68% of Promoters made a purchase within the two months following the survey.
There is a clear difference in behavior between Detractors and Promoters even before the survey was completed.
Positive experiences further increased the likelihood of future purchases—19.43% of Promoters made a purchase within three months after the survey.
In contrast, negative experiences reduced that likelihood.
Segmenting data by other criteria can help answer questions like:
What factors negatively influenced the willingness to buy again?
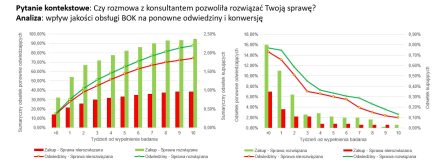
Example I – The Impact of Problems on Conversion
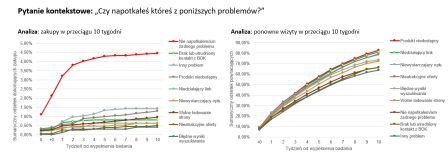
Conversion analysis in the context of negative experiences allows you to estimate how strongly such issues impact customer experience (CX).
As shown above, each reported problem significantly reduces delayed purchases.
Only users who did not encounter any issues returned and made purchases in the following weeks.
On the right-hand chart, we can see that problems do not significantly affect return visits to the website.
The highest delayed conversion rate (purchases/return visits) is observed among those who experienced no issues, while the lowest is among users who faced incorrect search results.
Example II – The Impact of Experience on Purchases
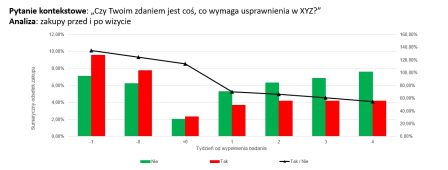
This example clearly shows that users who now believe there is something that needs improvement had a higher purchase rate before completing the survey than those who saw no need for improvement.
After the visit during which the survey was completed, a steady decline in purchase frequency is observed among those reporting the need for improvement.
In contrast, users who didn’t see any issues continued to buy more frequently.
This indicates that negative experiences during a visit have a strong impact on conversion.
Example III – Customer Support Contact and Retention
Analyzing customer support (CS) experiences in the context of later behavior reveals the real impact of those experiences on customer actions.
As shown in the analysis above, issue resolution by a support agent has little effect on visit frequency, but it has a significant influence on purchase intent.
The positive impact of having an issue resolved is clearly visible for up to four weeks after the interaction.
Example IV – Site Abandonment and Return Visits
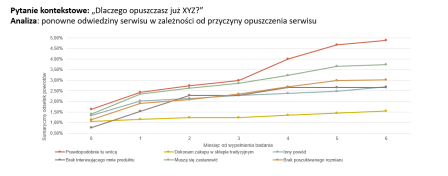
An analysis of return visits based on reasons for leaving the site highlights which issues contribute most to users not coming back.
The example confirms that users who express an intention to return or who say they need more time to decide are the most likely to revisit.
In contrast, the lowest likelihood of returning is observed among users who preferred offline shopping.
Lack of available sizes or products also negatively affects return visits.
These users can be effectively targeted in the next step with tailored remarketing campaigns.