Net Promoter Score (NPS)
Net Promoter Score is a widely used methodology for measuring customer loyalty. It was designed to provide a simple and reliable way to assess customer satisfaction and estimate its impact on business growth.
The NPS is based on a single core question:
"How likely are you to recommend our brand/product/service to a friend or colleague?"
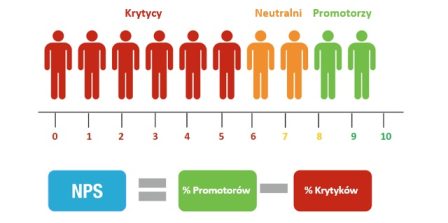
Respondents answer on a scale from 0 (not at all likely) to 10 (extremely likely). Based on their responses, customers are classified into three groups:
Detractors (scores 0–6): Dissatisfied customers who are unlikely to recommend the brand and may even discourage others.
Passives (scores 7–8): Satisfied but unenthusiastic customers who are vulnerable to competitive offerings.
Promoters (scores 9–10): Loyal enthusiasts who will keep buying and refer others, fueling growth.
The goal of NPS analysis is twofold: to understand the root causes of dissatisfaction among Detractors and take corrective action, and to identify the key strengths of the brand through the eyes of Promoters, using this insight to convert more customers into advocates.
The NPS score itself is calculated by subtracting the percentage of Detractors from the percentage of Promoters:
NPS = % Promoters − % Detractors
For example, if 50% of respondents are Promoters, 20% are Passives, and 30% are Detractors, the resulting NPS score is 20 (50 − 30). Passives are not included in the final calculation.
How to design a survey with an NPS question:
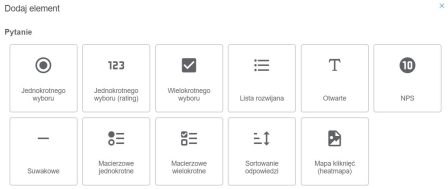
To create a survey with an NPS question, go to the “Surveys” section, then select “Add survey” or open the Survey Editor if the survey is already created. From the list of question types, choose “NPS” and enter the question text.
The YourCX platform automatically analyzes the results for this type of question.
NPS question results:
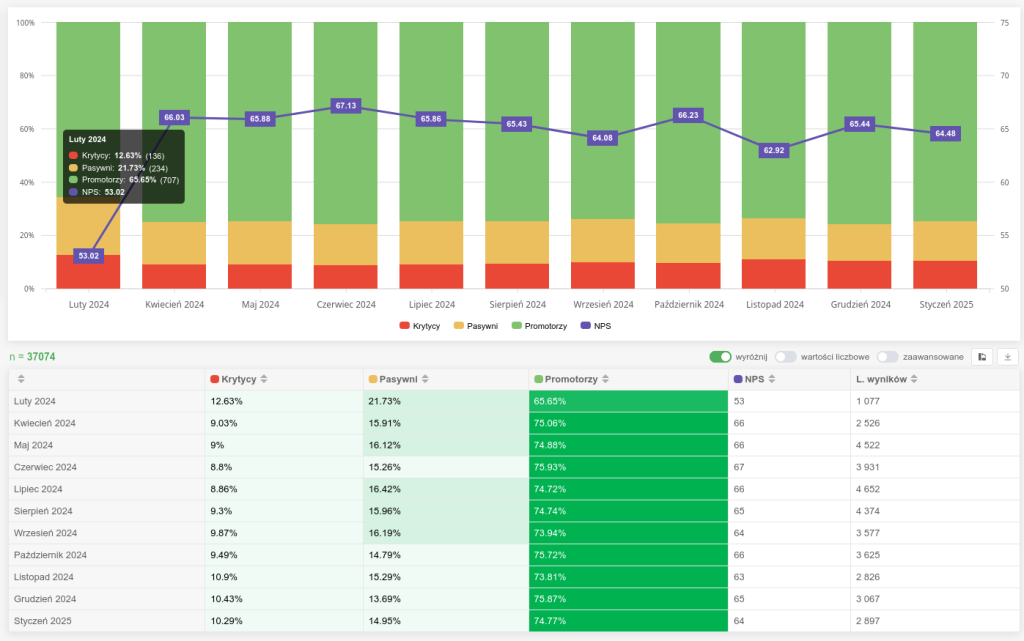
The chart and table above illustrate the monthly results of the NPS (Net Promoter Score) question. The chart includes several elements:
A breakdown of detractors, passives, and promoters
A line showing the NPS score over time
A table with detailed data
How to analyze NPS results like this
Tracking the trend over time
The chart shows how the percentage of detractors, passives, and promoters changes from month to month.
The NPS line allows you to follow the overall trend – whether the score is improving, stabilizing, or declining.
For example, in February 2024 the NPS was 53, rose to 66–67 around June–July, and stabilized around 63–65 towards the end of the year.Identifying fluctuations and turning points
If the NPS significantly changes in a given month, it’s worth checking whether any changes were introduced to the product/service at that time, or whether seasonal events occurred (e.g., holidays, promotions).
In the example data, there is a noticeable increase from February (53) to April (66), which could indicate successful actions that improved customer satisfaction or other influencing factors (e.g., a marketing campaign).Analyzing the ratio of detractors to promoters
Also important is the number of respondents (No. of results).
Each month has a different response volume, which affects the statistical reliability of the results.
If the sample size drops significantly in one month (e.g., from 4,500 responses to 1,000), the results may be more susceptible to fluctuations.Context and further segmentation
At this stage, we have a general picture of the NPS results. To understand the causes of changes, it’s worth exploring segmentation (e.g., by region, contact channel, age group) or applying other filters to see in which customer groups the greatest improvements or declines occurred.
For example, if the percentage of promoters slightly drops in August, segmentation might reveal that customers using a newly introduced channel (e.g., mobile app) encountered some issues.
